- Global Distribution of Open Access Items (June 2012)
- Global Growth of Open Access Items (2004-2012)
- Subjects of Open Access Items (July 2012)
- Publication Years of Open Access Items (June 2012)
- TOP 25 Countries adding Open Access Journals to DOAJ (2002-12)
- Type of Open Access Items (July 2012)
- Languages of Open Access Items (June 2012)
- Map of Publish-or-Perish-Land (2012)
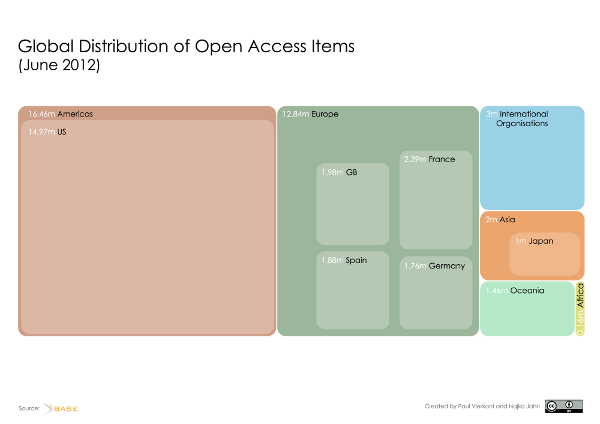
Global Distribution of Open Access Items (June 2012)
For the research data see: http://dx.doi.org/10.6084/m9.figshare.96582
The treemap visualizes the origin of Open Access items [Fn 01] indexed in the Bielefeld Academic Search Engine (BASE) [Fn 02] on June 27th, 2012. [Fn 03] It shows the continents Europe, Asia, the Americas (North and South America), Oceania, Africa as well as International Organizations highlighting leading countries of each continent. The dominance of the United States of America providing as many Open Access items as Europe and Asia together becomes clear. Pointing out the small amount of Open Access items from Africa the visualization proves that the digital divide is also true for Open Access.
The visualization was created by Paul Vierkant using the IBM online visualization tool ”Many Eyes” [Fn 04] and Adobe Illustrator to visualize the data from BASE provided by Najko Jahn. Except where otherwise noted, this work is licensed under http://creativecommons.org/licenses/by/3.0/
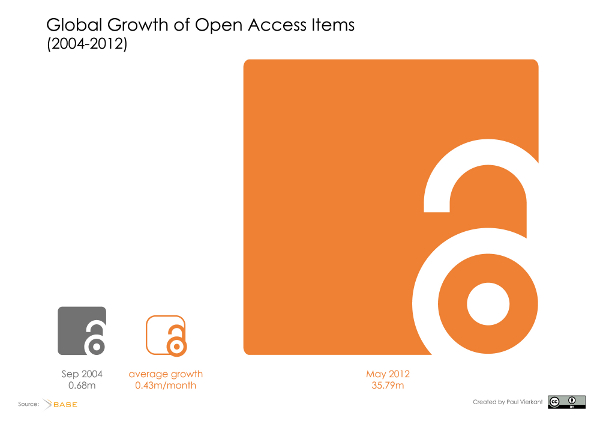
Global Growth of Open Access Items (2004-2012)
For the research data see: http://dx.doi.org/10.6084/m9.figshare.96558
The visualization shows the total growth of Open Access items [Fn 05] indexed in the Bielefeld Academic Search Engine (BASE) [Fn 06] from September 2004 until May 2012. The graphic illustrates the amount of Open Access items by relating it to the size of a square. The square on the left depicts the size when BASE started its service in September 2004 with about 680.000 Open Access items. The second square shows the average growth of Open Acess items in the period from September 2004 to May 2012. The last and largest square shows the amount of Open Access items in May 2012. Comparing the squares the enormous growth of Open Access items in the last eight years is visible. The size of the square of the average growth reflects this development as it is almost large as the entire amount of Open Access items indexed back in 2004.
The visualization was created by Paul Vierkant using Adobe Illustrator to visualize the data provided by BASE [Fn 07]. Except where otherwise noted, this work is licensed under http://creativecommons.org/licenses/by/3.0/
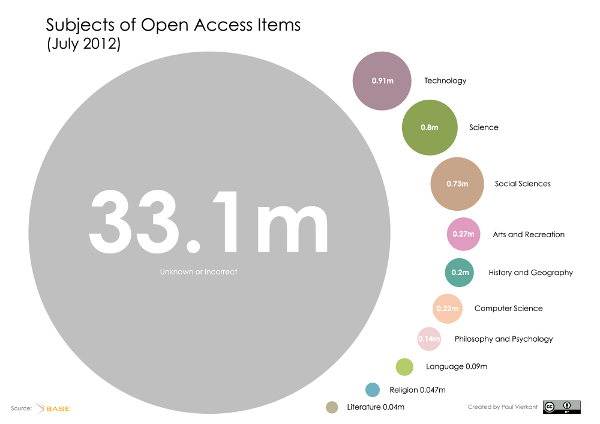
Subjects of Open Access Items (July 2012)
For the research data see: http://dx.doi.org/10.6084/m9.figshare.96585
The bubble chart shows the subjects [Fn 08] of Open Access items [Fn 09] indexed in the Bielefeld Academic Search Engine (BASE) [Fn 10] on July 5th, 2012. The visualization illustrates the amount of Open Access items classified according to the main class level of the DDC [Fn 11] relating it to the size of a bubble. Beyond merely giving an overview of the distribution of the subjects the graphic shows that the major part of Open Access items is not or incorrectly classified, deteriorating findability and visibility. This lack of information points out the need of proper and compliant metadata of publications and research data.
The visualization was created by Paul Vierkant using the IBM online visualization tool ”Many Eyes” [Fn 12] and Adobe Illustrator to visualize the data provided by BASE [Fn 13] on July 5th, 2012. Except where otherwise noted, this work is licensed under http://creativecommons.org/licenses/by/3.0/
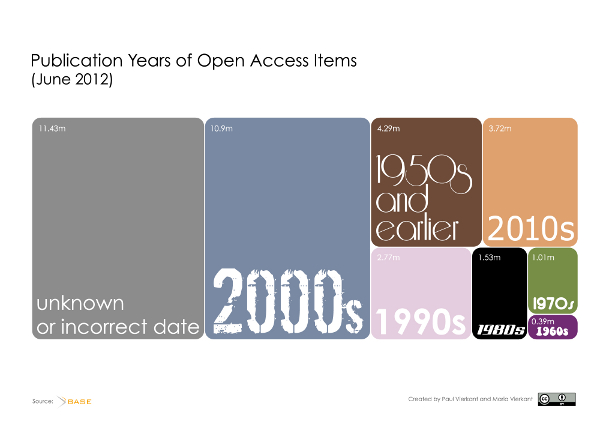
Publication Years of Open Access Items (June 2012)
For the research data see: http://dx.doi.org/10.6084/m9.figshare.96586
The treemap shows the years of publications of Open Access items [Fn 14] indexed in the Bielefeld Academic Search Engine (BASE) [Fn 15] on June 22nd, 2012. Publications years are summarized in decades. The decades range from 1950s and earlier until the 2010s. The increase of published items throughout the decades is clearly visible. The visualization also reveals that the publication date of almost one third of all items is either unknown or incorrect, deteriorating findability and visibility. This lack of information stresses the need of proper and compliant metadata of publications and research data.
The visualization was created by Paul Vierkant and Maria Vierkant using the IBM online visualization tool ”Many Eyes” [Fn 16] and Adobe Illustrator to visualize the data provided by BASE [Fn 17]. Except where otherwise noted, this work is licensed under http://creativecommons.org/licenses/by/3.0/
TOP 25 Countries adding Open Access Journals to DOAJ (2002-12)
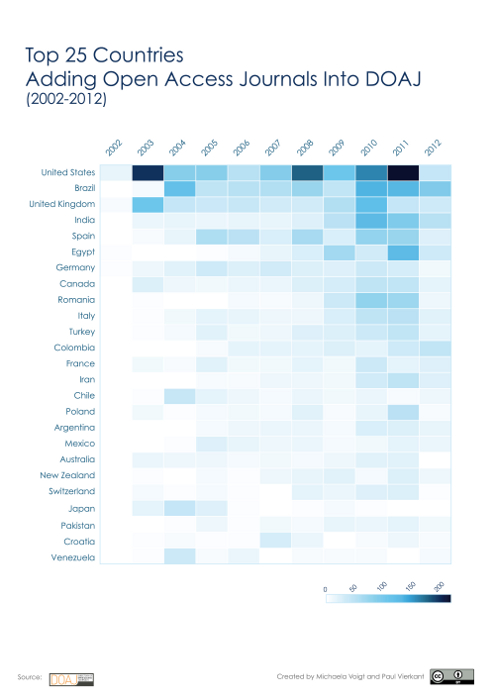
For the research data see: http://dx.doi.org/10.6084/m9.figshare.96587
The heatmap shows the number of journals added to DOAJ from 2002 until July, 2012 by the top 25 countries. [Fn 18] The rows indicate the countries with the ones contributing the most at the top of the map. [Fn 19] The columns represent the years in which the journals where added to DOAJ. The darker a cell is the more journals were added in that year. There is no constant growth of Open Access journals visible, as for example the United States had peaks in 2003 and 2008. Interestingly enough, countries such as Brazil, India and Egypt are ranked higher than most European countries with strong Open Access movements.
The visualization was created by Michaela Voigt and Paul Vierkant using R [Fn 20] and a tutorial from flowingdata.com [Fn 21] to visualize data from DOAJ [Fn 22]. Except where otherwise noted, this work is licensed under http://creativecommons.org/licenses/by/3.0/
Type of Open Access Items (July 2012)
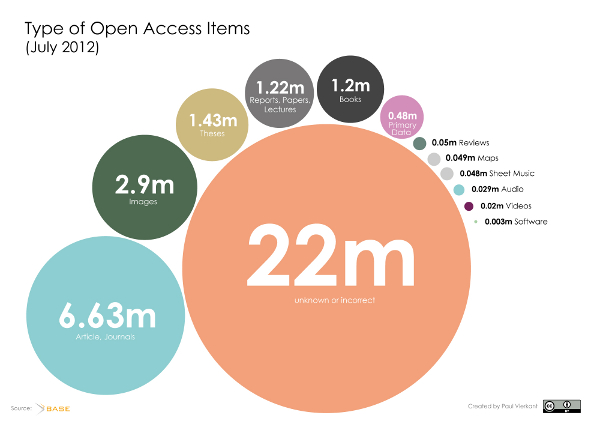
For the research data see: http://dx.doi.org/10.6084/m9.figshare.96584
The bubble chart shows the type [Fn 23] of Open Access items [Fn 24] indexed in the Bielefeld Academic Search Engine (BASE) [Fn 25] on July 5th, 2012. The chart visualizes the amount of Open Access items according to their type relating it to the size of a bubble. Beyond merely giving an overview of the distribution of the document types the graphic reveals that the document type of almost two thirds of all Open Access items is unkown or incorrect, deteriorating findability and visibility. This lack of information stresses the need of proper and compliant metadata of publications and research data.
The visualization was created by Paul Vierkant using the IBM online visualization tool ”Many Eyes” [Fn 26] and Adobe Illustrator to visualize the data provided by BASE [Fn 27] on July 5th, 2012. Except where otherwise noted, this work is licensed under http://creativecommons.org/licenses/by/3.0/
Languages of Open Access Items (June 2012)
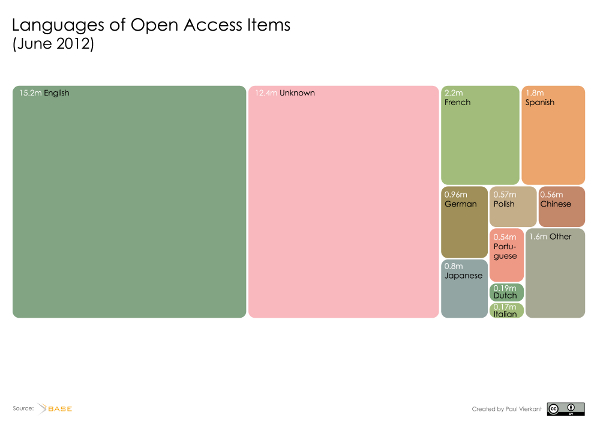
For the research data see: http://dx.doi.org/10.6084/m9.figshare.96583
The treemap shows the languages of Open Access items [Fn 28] indexed in the Bielefeld Academic Search Engine (BASE) [Fn 29] on June 22nd, 2012. With about 40% of English Open Access items the visualization supports the assumption that in most countries English is the language of science. However the graphic illustrates that the language of more than one third of all items is unknown, deteriorating findability and visibility. This lack of information stresses the need of proper and compliant metadata of publications and research data.
The visualization was created by Paul Vierkant using the IBM online visualization tool ”Many Eyes” [Fn 30] and Adobe Illustrator to visualize the data provided by BASE [Fn 31]. Except where otherwise noted, this work is licensed under http://creativecommons.org/licenses/by/3.0/
Map of Publish-or-Perish-Land (2012)
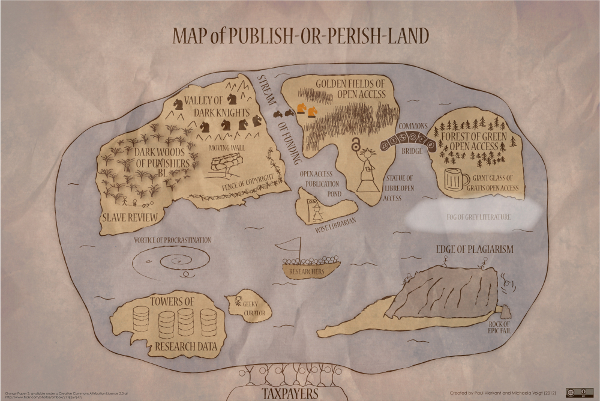
The map depicts the current situation of researchers being forced to publish or to perish. Focusing on electronic and Open Access publishing, the map is meant to visualize in an ironic manner the different paths researchers can take when being confronted with the question how and where to publish their works.
The visualization was created by Paul Vierkant and Michaela Voigt using Adobe Illustrator. The map was inspired by an XKCD comic dating from 2007. [Fn 33] Except where otherwise noted, this work is licensed under http://creativecommons.org/licenses/by/3.0/
Fußnoten
[01] ”Items” refers to full-text publications and research data. ”Global” is used in this context because BASE is one of the largest Open Access search engines worldwide indexing more than 2.000 sources. See: http://www.base-search.net/about/en/about_sources_date_dn.php?menu=2 [zurück]
[02] http://www.base-search.net/ [zurück]
[03] http://www.base-search.net/about/en/faq.php?#chap03 [zurück]
[04] http://www-958.ibm.com/software/data/cognos/manyeyes/ [zurück]
[05] ”Items” refers to full-text publications and research data. ”Global” is used in this context because BASE is one of the largest Open Access search engines worldwide indexing more than 2.000 sources. See: http://www.base-search.net/about/en/about_sources_date_dn.php?menu=2 [zurück]
[06] http://www.base-search.net/ [zurück]
[07] http://www.base-search.net/about/en/about_statistics.php?menu=2 [zurück]
[08] The subject scheme used to classify the items is the Dewey Decimal Classification (DDC). See http://www.oclc.org/dewey/ [zurück]
[09] ”Items” refers to full-text publications and research data. [zurück]
[10] http://www.base-search.net/ [zurück]
[11] http://www.base-search.net/Browse/Dewey [zurück]
[12] http://www-958.ibm.com/software/data/cognos/manyeyes/ [zurück]
[13] http://www.base-search.net/Browse/Dewey [zurück]
[14] ”Items” refers to full-text publications and research data. [zurück]
[15] http://www.base-search.net/ [zurück]
[16] http://www-958.ibm.com/software/data/cognos/manyeyes/ [zurück]
[17] http://www.base-search.net/Browse/Dewey [zurück]
[18] http://www.doaj.org/doaj?func=byCountry&uiLanguage=en [zurück]
[19] The total list contains 120 countries. [zurück]
[20] http://www.r-project.org/ [zurück]
[21] http://flowingdata.com/2010/01/21/how-to-make-a-heatmap-a-quick-and-easy-solution/ [zurück]
[22] http://www.doaj.org/doaj?func=byCountry&uiLanguage=en [zurück]
[23] The document types are based on the classification used by BASE. See http://www.base-search.net/Browse/DocType?fullbrowser=1 [zurück]
[24] ”Items” refers to full-text publications and research data. [zurück]
[25] http://www.base-search.net/ [zurück]
[26] http://www-958.ibm.com/software/data/cognos/manyeyes/ [zurück]
[27] http://www.base-search.net/Browse/Dewey [zurück]
[28] ”Items” refers to full-text publications and research data. [zurück]
[29] http://www.base-search.net/ [zurück]
[30] http://www-958.ibm.com/software/data/cognos/manyeyes/ [zurück]
[31] http://www.base-search.net/Browse/Dewey [zurück]
[32] xkcd: ”Online Communities”, http://xkcd.com/256/ [zurück]
Paul Vierkant ist an der Humboldt-Universität zu Berlin als Mitarbeiter im DFG-Projekt re3data.org tätig, das den Aufbau eines Verzeichnisses für Forschungsdatenrepositorien zum Ziel hat. Vorher war Paul Vierkant bei der Bibliothek der Universität Konstanz als Projektkoordinator ebenfalls zweier DFG-Projekte (Verknüpfung von Fach- und institutionellen Repositorien; Aufbau einer virtuellen Forschungsumgebung) beschäftigt.